Data Allocation Pentaho Data Integration example
Example case
The objective of this tutorial example is to make a case study analysis of allocating a measure when loading the data warehouse. A production planning sample data will be used. The following dimensions and measures will be considered:
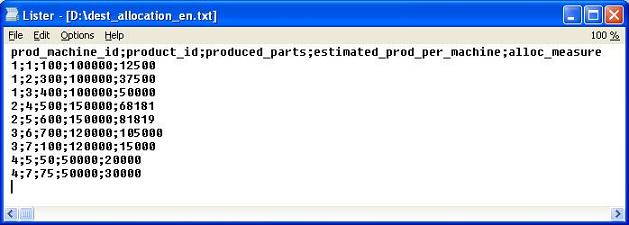
Data allocation source file contents is listed below. The last column shows the result estimated at the end of the lab:
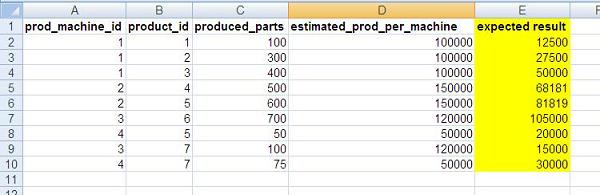
The following assumptions have been made for this business scenario:
Pentaho Data Integration transformation
-
The algorithm for allocating a measure by another measure is as follows:
- Get the source data (ms excel file in this case)
- Sort the data by prod_machine_id (the field will be used as a key for grouping)
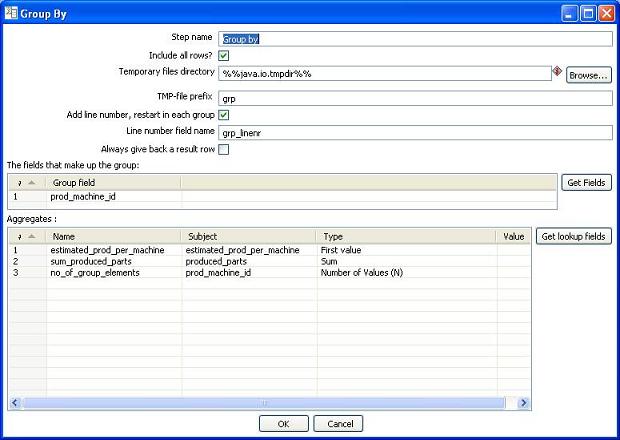
- Group the data by prod_machine_id and make the following aggregates:
- First value of estimated_prod_per_machine (the number is identical for each prod_machine_id so avg or last as an aggregation type would also do)
- Summarized number of produced parts, used for calculating weights
- Number of elements in each group, will be used for recognizing the last element of each group
- Line number for each group is stored in the Grp_linenr field and the counter restarted for each group - Calculate the allocated measure value using the following formula: (produced_parts/sum_produced_parts)*estimated_prod_per_machine
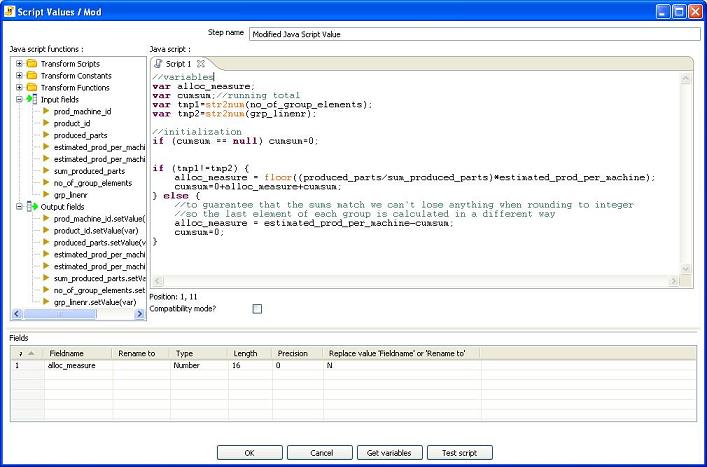
To make sure the data is consistent, the last element of each group is calculated in the following way: estimated_prod_per_machine-cumsum (cumulated sum of prevous elements for the group)
Detail solution description
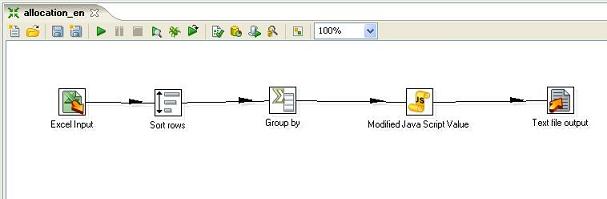
The sample transformation shown in this lab is implemented in Pentaho Data Integration (Spoon).
Allocation PDI transformation overview. The transfrom gets data from an extract, allocates one measure by another and saves output into a textfile:
The data is sorted and grouped and variables needed for further processing are calculated:
The final data allocation assignment is performed in this simple javascript step.:
The text file output shows an additional measure which is calculated using the allocation algorithm. :
Please refer to the Data allocation considerations on the data warehousing tutorial main page to get more background information and techniques on allocating data.