Data warehouse for monitoring and analyzing site traffic
Goal
Design an ETL process to fill in a data warehouse structure and data marts with the statistics of the ETL Tools Info portal traffic and other pages owned by the GoliInfo company. The data needs to be flexible and easily accessible for the purpose of reporting and OLAP analysis.
Scenario overview and details
GoliInfo currently owns seven different web portals which are hosted on one server with a common logging database. One of the company's revenue generator is a cooperation with an advertisement company in publishing ads and banners.
Each site visit is logged on the web hosting server in the MySQL database and contains quite detailed information. The advertisement partner also provides an input for the data mart - the data about page impressions, users visits and revenue generated by them.
It is possible to generate some simple reports directly from the database using select statements, but it is slow and the information is incomplete and the reporting is not flexible.
In order to increase the revenue generated by the websites there is a need to analyze the traffic in more detail and find the sites which populate most of the revenue.
Input data:
- Site traffic log - an extract generated on the webserver by a PHP script. It uses start date and end date as a parameter and those dates are reflected in a filename
- A CSV summary file with the advertisement campaign data is provided via email
Output data:
- Data Warehouse fact tables with the processed data, based on a time of the visit.
- A few Data Marts which contain aggregations and are subject oriented. The subjects are: portal, visiting host, visited page, referrer, time of the day, top revenue generators, etc.
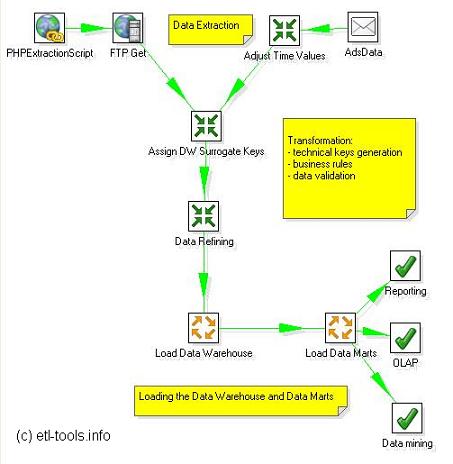
ETL Process step by step
Extraction
Extract generated on a web server.
Transformation
Loading steps
Information delivery
Implementation