Excel crosstabs, pivot tables FAQ and best practices
- Step 1. Select the source fields you want to make available as summarized data fields
Excel cube summarized fields: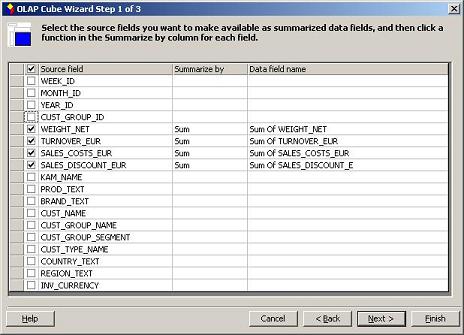
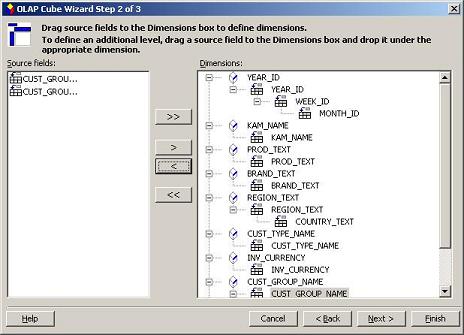
- Step 2. Drag source fields to the Dimensions box to define dimensions. Please note that the dimensions can be selected in multiple levels (as the time dimension in the example)
Excel cube dimensions window:
- Step 3. What kind of cube do you want to create?
- Rebuild the cube every time the report is opened, and retrieve the data for the cube only when needed.
- Rebuild the cube every time the report is opened, and retrieve all data for the cube at once.
- Save a cube file containing all data for the cube. - we will use that option in the example. This will create a .cub file with the data and .oqy file with the OLAP cube definition
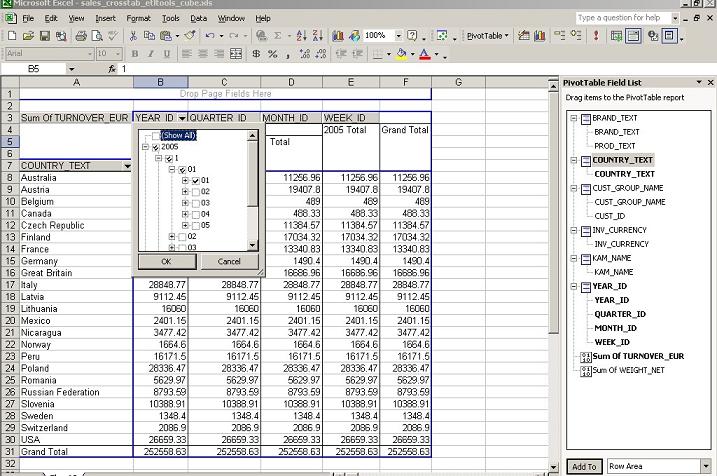
The cube pivot table is shown below. It looks very similiar to a normal excel pivot table at a first glance but there are a few differences between excel cube and crosstab:
- The greatest advantage of an excel cube over a simple crosstab is that the data is stored externally in a .cub file and the connection parameters in a .ogy file. It makes the solution more flexible and enables users to share the data across multiple spreadsheets - for example by placing the .cub file on a share drive.
- The 'PivotTable Field List' window shows the dimensions hierarchy and the columns are distinguished between facts and dimensions by different icons on the left beside the labels
- Users can select multiple values one by one in the crosstab area dimension fields (both rows and columns)
- Hierarchy is implemented in the crosstab area dimension fields (both in rows and columns)
- Some VBA functions and methods apply only to cubes and other apply only to simple pivot tables.Excel olap cube
2.1. Excel olap cube example
Excel crosstab generated with a 'create OLAP Cube from this query'
When this option is selected, the data will be stored externally in a file and the funcionality of a crosstab would be extended. That type of excel pivot table is called an excel cube or pivot table cube.
An excel cube is created by selecting 'create OLAP Cube from this query' in the crosstab generation dialog window. Selecting the option will open an OLAP Cube Wizard which has three steps.