Using Pentaho Cube Designer to create Mondrian cubes
Mondrian Cube Schema file
In order to use a custom data model in Pentaho, it’s necessary to create a Mondrian Cube Schema file containing the definition of OLAP cubes. The file describes dimensions, hierarchies, levels and facts and maps them onto a relational data model.
The Mondrian Cube Schema is an XML file which can be created manually. However, it can be a time consuming task so it’s highly recommended to use the Pentaho Cube Designer standalone application to create the data model.
The problem is that the current version (Pentaho Cube Designer 0.7.2.0) has it’s limitations and doesn’t support all Mondrian Schema features and basically doesn’t perform very well with complex data models. It doesn’t support aggregation, shared dimensions, calculated members, inline tables and multiple cubes within the same schema files.
Despite that, Pentaho Cube Designer is still a useful product which for sure can be used as a good starting point in creating multidimensional models in Pentaho. When working with complicated logical data models, the Cube Designer may be used as a tool to create basic mappings and then the advanced features may be easily added manually by editing the XML schema mapping file.
Below a step by step instructions on how to create a simple Mondrian Cube using Pentaho Cube Designer.
We will use the following snowflake architecture for the purpose of that tutorial:
Snowflake schema example
The Cube will contain the following data:
- 3 Fact fields – Sales, Costs and Discounts
- Time Dimension – with the following hierarchy: Year, Quarter and Month
- 2 Customer Dimensions – one with location (Region, Country) and the other with Customer Group and Customer Name
- Product Dimension – containing a Product Name
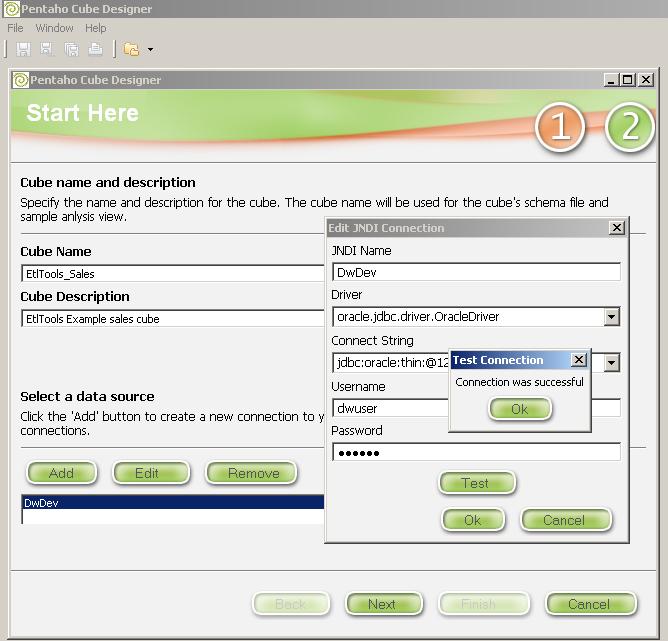
1. Basic cube information and connection parameters
First step is to provide basic cube information which are cube name and description. The name should be simple and descriptive as it will be used in the definitions and configuration files throughout all our Pentaho BI applications.
In the bottom part of the screen we define a database connection to the source data. There’s a wizard which makes it really easy to set up a connection and test it.
In the following Pentaho Tutorial we created a EtlTools_Sales cube, connection named DwDev and used Oracle as a source database.
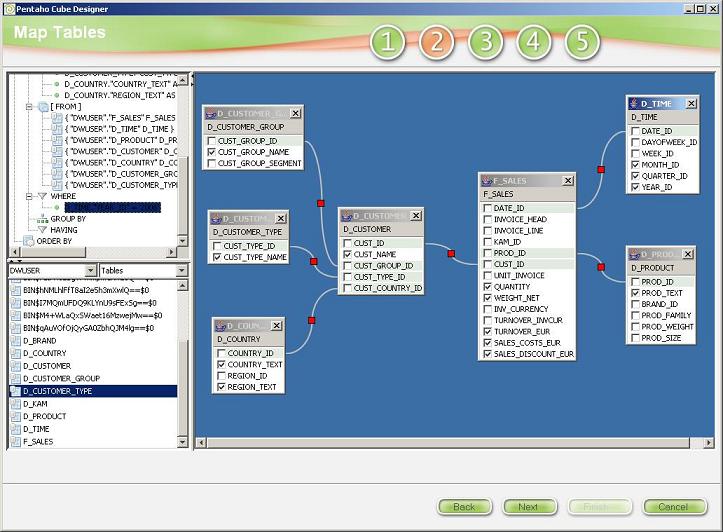
2. Define a relational data model and tables mapping
In the ‘Map Tables’ screen you can define the relational data model of a cube that will be created. Tables can be selected by double clicking on the bottom left-hand side panel of the window. The links between tables can be easily created by dragging and dropping the key fields and the target fields can be selected by clicking on a checkbox beside the desired field.
Here you can also add conditions (WHERE clauses), grouping and source records ordering.
Let’s have a look at the screenshot below which depicts a relational data model representing snowflake schema DW architecture.
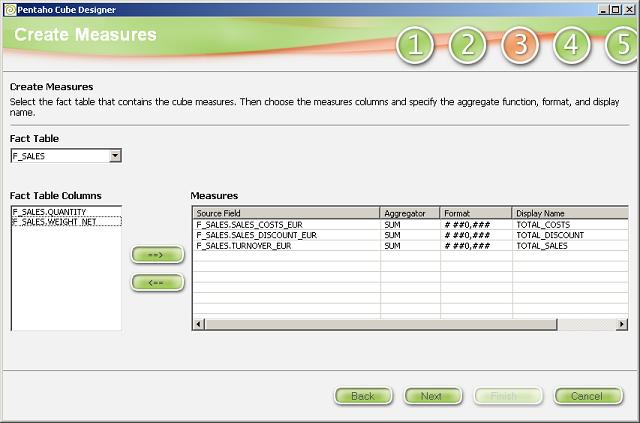
3. Select fact tables and create measures
After selecting and configuring the source tables, the next step is to point to the fact table and select summary fields. In that tutorial we will use the following numeric fields: TOTAL_COSTS, TOTAL_DISCOUNT and TOTAL_SALES.
You can change the type of aggregation here (available types are: SUM, AVG, COUNT, MIN, MAX), the format of numeric values and the column names.
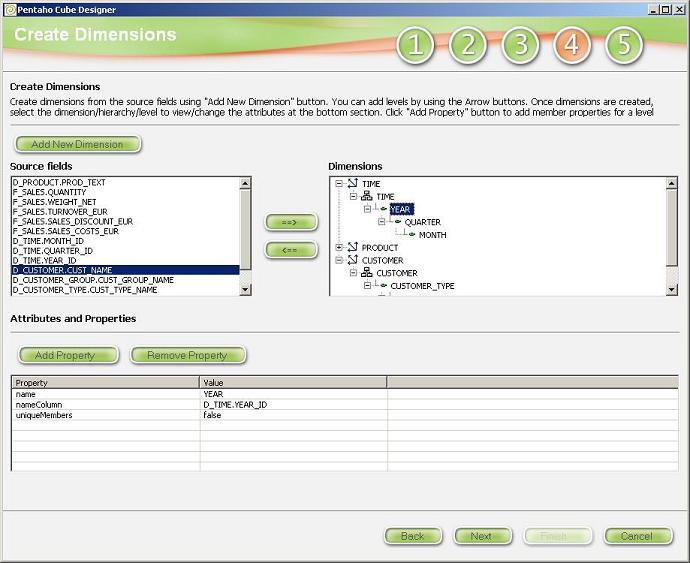
4. Create dimensions
The next step is to create dimensions in the cube. To create a dimension, select the field from ‘source fields’ which is the highest in the hierarchy and click the ‘Add New Dimension’ button and enter the dimension’s name. Use the arrow buttons to create levels.
For example, to create a time dimension, select the YEAR_ID, click the ‘Add New Dimension’ button, rename it to TIME and click OK. Then select the QUARTER_ID and MONTH_ID fields accordingly, click the right arrow for each of them and it will create the next levels in the time hierarchy.
5. Save the schema file
Click ‘View XML’ to see the configuration file content, review it and if it’s ok click ‘Finish’ to generate the file.
The schema definition file in that example is ETLTOOLS_SALES.mondrian.xml and has the following contents:
<?xml version="1.0" encoding="UTF-8"?>
<Schema name="ETLTOOLS_SALES">
    <Cube name="ETLTOOLS_SALES">
        <Table name="F_SALES"/>
        <Dimension name="TIME" foreignKey="DATE_ID">
            <Hierarchy name="TIME" hasAll="true" allMemberName="All time" primaryKey="DATE_ID">
                <Table name="D_TIME"/>
                <Level name="YEAR" table="D_TIME" column="YEAR_ID" uniqueMembers="false"/>
                <Level name="QUARTER" table="D_TIME" column="QUARTER_ID" uniqueMembers="false"/>
                <Level name="MONTH" table="D_TIME" column="MONTH_ID" uniqueMembers="false"/>
            </Hierarchy>
        </Dimension>
        <Dimension name="PRODUCT" foreignKey="PROD_ID">
            <Hierarchy name="PRODUCT" hasAll="true" allMemberName="All product" primaryKey="PROD_ID">
                <Table name="D_PRODUCT"/>
                <Level name="PRODUCT_NAME" table="D_PRODUCT" column="PROD_TEXT" uniqueMembers="false"/>
            </Hierarchy>
        </Dimension>
        <Dimension name="CUSTOMER_LOCATION">
            <Hierarchy name="CUSTOMER_LOCATION" hasAll="true" allMemberName="All customer_location">
                <Table name="D_COUNTRY"/>
                <Level name="CUSTOMER_REGION" table="D_COUNTRY" column="REGION_TEXT" uniqueMembers="false"/>
                <Level name="CUSTOMER_COUNTRY" table="D_COUNTRY" column="COUNTRY_TEXT" uniqueMembers="false"/>
            </Hierarchy>
        </Dimension>
        <Dimension name="CUSTOMER" foreignKey="CUST_ID">
            <Hierarchy name="CUSTOMER" hasAll="true" allMemberName="All customer" primaryKey="CUST_ID">
                <Table name="D_CUSTOMER"/>
                <Level name="CUSTOMER_GROUP" table="D_CUSTOMER" column="CUST_GROUP_ID" uniqueMembers="false"/>
                <Level name="CUSTOMER_NAME" table="D_CUSTOMER" column="CUST_NAME" uniqueMembers="false"/>
            </Hierarchy>
        </Dimension>
        <Measure name="TOTAL_SALES" column="TURNOVER_EUR" aggregator="sum"
			datatype="Numeric" formatString="# ##0,###"/>
        <Measure name="TOTAL_COSTS" column="SALES_COSTS_EUR" aggregator="sum"
			datatype="Numeric" formatString="# ##0,###"/>
        <Measure name="TOTAL_DISCOUNT" column="SALES_DISCOUNT_EUR" aggregator="sum"
			datatype="Numeric" formatString="# ##0,###"/>
    </Cube>
</Schema>