Populate Dimensions in a Fact table under SAS
Please find below an example of how to populate random dimensions in a fact table
Lesson assumptions and objectives:
Please refer to the comments (in green) included in the SAS program attached below.
* create a dataset in a work folder ;
data facts_date_ids;
* initial parameters;
dt_min='01jan2005'd;
dt_max='31dec2007'd;
cnt_cust=21;
cnt_prod=22;
prod_type_cnt=2;
prod_age_cnt=6;
obs_to_populate=2000;
* format date to dd-mm-yyyy format ;
format DT DDMMYYD10.;
*loop to generate records;
DO i=1 TO obs_to_populate;
/* generate random date between min and max date*/
DT=dt_min+ranuni(0)*(dt_max-dt_min);
/*make less sales in sundays than saturdays and weekends less than in weekdays */
if weekday(dt)=1 then dt=dt_max-ranuni(1)*(dt_max-dt_min);
if weekday(dt)=7 then dt=dt_max-ranuni(2)*(dt_max-dt_min);
if weekday(dt)=1 then dt=dt_max-ranuni(3)*(dt_max-dt_min);
/* customer - when absolute value of normal distribution random (rannor) is greater then a limit then populate a number in second half of the population */
idc = int(1+abs(rannor(123))*10);
* if populated value exceeds the limit, populate it again using normal distribution (ranuni);
if idc>cnt_cust then idc = int(cnt_cust/2+ranuni(123)*(cnt_cust/2));
/* products - the same as customers - when absolute(rannor) is greater then limit, populate a number in second half of the population */
idp = int(1+abs(rannor(3456))*20);
* if populated value exceeds the limit, populate it again using normal distribution (ranuni);
if idp>cnt_prod then idp = int(cnt_prod/2+ranuni(123)*(cnt_prod/2));
/*prod type*/
prod_type = int(1+ranuni( 0)*prod_type_cnt);
/*product age*/
if prod_type=1 then prod_age=1; * set age for seeds to zero;
else prod_age = int(2+ranuni(0)*(prod_age_cnt-1));
output;
END;
/*keep only the relevant fields*/
keep dt idc idp prod_type prod_age;
run;
*quick look at the populated figures ;
PROC MEANS data=facts_date_ids
min max MAXDEC=0;
class prod_age;
var prod_type ;
RUN;
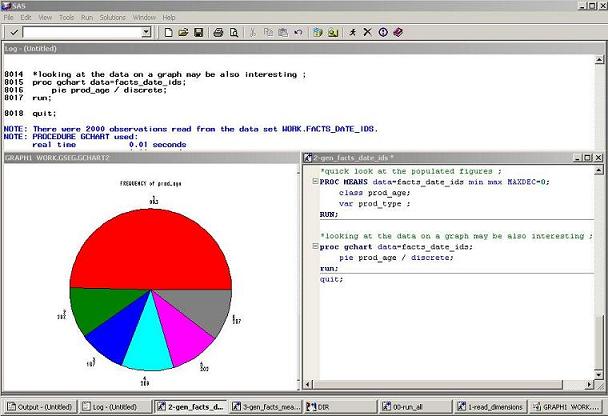
*looking at the data on a graph may be also interesting ;
proc gchart data=facts_date_ids;
pie prod_age / discrete;
run;
quit;
Use PROC MEANS and PROC GCHART to check the newly generated data: